
 by
by
Which Statistical Analysis Software To Choose For Data
Estimated reading time: 14 minutes, 6 seconds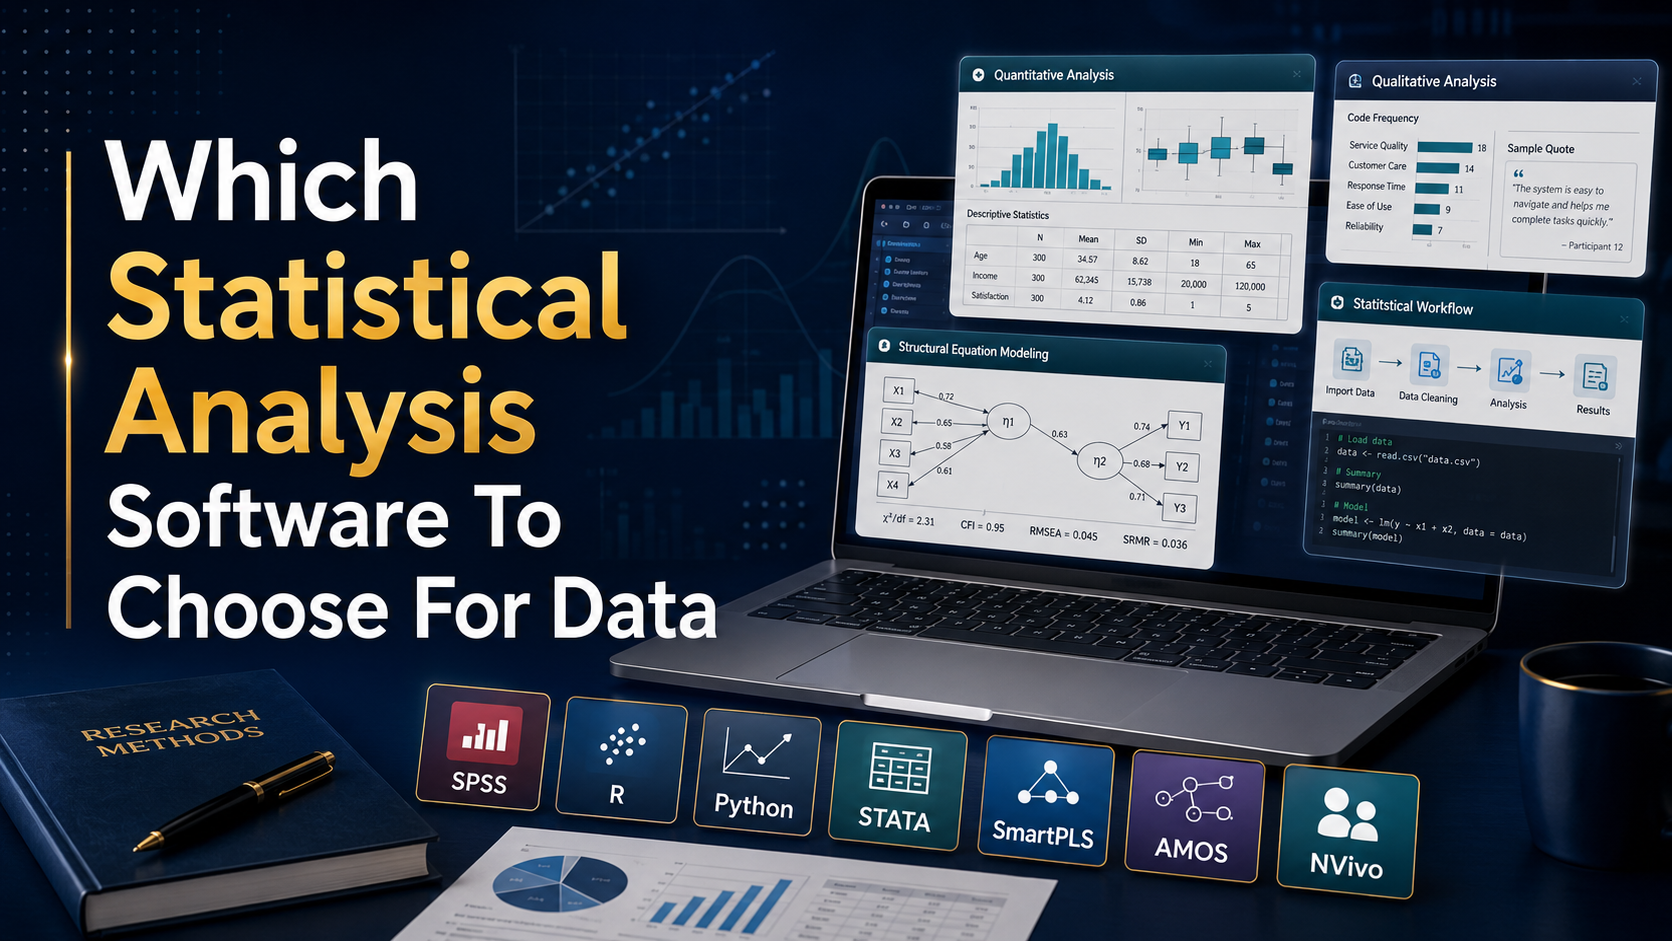
Best Statistical Software for Researchers: SPSS, R, SAS, Stata, MATLAB, and Excel Compared
Quick summary: Choosing statistical software depends on your field, your budget, and how comfortable you are with coding. SPSS suits social science and healthcare researchers who want a menu-driven interface. R fits data scientists and statisticians who need open-source flexibility. SAS handles large-scale healthcare and finance datasets. Stata is the standard for economics and public health econometrics. MATLAB serves engineers running simulations. Excel remains the fastest entry point for basic analysis on smaller datasets. This guide breaks down what each tool does well, where it falls short, and who should use it, based on the analytical needs researchers most commonly run into while working on theses, dissertations, and published papers. It also covers how scholars who feel stuck at the analysis stage can get expert support rather than risk errors in a final submission.
- Best Statistical Software for Researchers: SPSS, R, SAS, Stata, MATLAB, and Excel Compared
- Key Takeaways
- Why Statistical Software Matters for Research
- 1. SPSS (Statistical Package for the Social Sciences)
- 2. R Programming
- 3. SAS (Statistical Analysis System)
- 4. Stata
- 5. MATLAB
- 6. Excel
- How to Choose the Right Statistical Software for Your Research
- Frequently Asked Questions
- How Qundeel Academic Consultancy Helps Students with Statistical Analysis
Key Takeaways
- There is no single “best” statistical software. The right choice depends on your discipline, dataset size, and technical comfort level.
- SPSS and Stata offer the easiest learning curve for non-programmers in social science and economics.
- R is free and highly flexible but requires coding knowledge and statistical background.
- SAS and MATLAB are built for scale and computation, not for beginners on a budget.
- Excel remains useful for smaller datasets and preliminary analysis but cannot handle advanced modeling.
- Software choice should follow your research design and thesis committee expectations, not the other way around.
- Scholars who need help selecting the right tool or running their analysis correctly can get support from data analysis specialists such as Qundeel Academic Consultancy, which works with PhD, MS, and MPhil researchers on statistical analysis for theses and dissertations.
Why Statistical Software Matters for Research
Every thesis, dissertation, or journal submission eventually rests on one question: do the numbers actually support the argument? Statistical software exists to answer that question accurately, consistently, and in a form other researchers can verify. Beyond running individual tests, the right software shapes how efficiently a scholar moves from raw data collection to a finished results chapter, and how confidently that chapter holds up under committee review or peer review.
The Core Benefits of Using Statistical Software
Accuracy and reliability. Manual calculation invites human error, especially across large datasets with multiple variables. Statistical software applies established methods consistently, which matters when a committee or peer reviewer checks your results line by line.
Time savings. Cleaning, transforming, and modeling data by hand can take days, particularly with messy survey data or datasets pulled from multiple sources. The same work often takes minutes with the right software, freeing up time for interpretation and writing rather than manual computation.
Clearer data visualization. Charts, plots, and graphical summaries help readers grasp patterns that raw tables cannot communicate as effectively. A well-chosen visualization can make the difference between a results chapter that reads clearly and one that leaves examiners asking basic questions.
Reproducibility. Because outputs are generated through documented, repeatable steps, other researchers can rerun the analysis and confirm the findings. This is one of the pillars of credible, citable research, and increasingly something journals and thesis committees expect scholars to demonstrate.
Handling large datasets. Modern research increasingly involves large sample sizes and multiple variables, particularly in fields like public health, econometrics, and social science surveys. Most statistical software is built to process that volume without slowing down or crashing, unlike spreadsheet tools pushed past their limits.
Supporting different research designs. Quantitative research spans everything from simple descriptive surveys to multi-variable structural equation modeling. The software you choose needs to support the specific design your study calls for, not just run basic tests.
1. SPSS (Statistical Package for the Social Sciences)
SPSS, owned by IBM, remains one of the most recognized names in statistical software. It is widely used across social science, healthcare, education, and market research, largely because its interface does not require programming knowledge. For scholars whose training is in their subject area rather than computer science, that accessibility carries real weight.
Key Features of SPSS
- Descriptive statistics, including mean, median, standard deviation, and frequency distributions
- Regression analysis, both linear and multiple regression models
- Hypothesis testing tools such as t-tests, chi-square tests, and ANOVA
- Reliability testing, including Cronbach’s alpha for survey-based research
- Built-in charting for bar charts, scatter plots, and histograms
- A syntax editor for researchers who eventually want to move beyond the point-and-click interface
SPSS Pros and Cons
SPSS’s biggest advantage is accessibility. A researcher with no coding background can run sophisticated tests through drop-down menus rather than writing code, which shortens the learning curve considerably for survey-based and social science research. The tradeoff is cost. SPSS licensing is expensive enough that it becomes a real barrier for smaller institutions, individual students, and independent researchers. It also lacks strong machine learning capabilities compared to newer tools, and its output formatting sometimes requires extra work before it is presentation-ready for a thesis appendix.
Who Should Use SPSS
Social science, healthcare, and market research scholars who prioritize ease of use over advanced modeling flexibility, and who have institutional access to a license, get the most value from SPSS. It works particularly well for survey-based theses that rely on descriptive statistics, reliability testing, and standard inferential tests.
2. R Programming
R is a free, open-source language built specifically for statistical computing and graphics. It has become the standard among statisticians, data scientists, and academic researchers who want full control over their models rather than working within a fixed menu.
Key Features of R
- A vast library ecosystem covering time series analysis, regression, and machine learning
- Advanced visualization through packages like ggplot2, which produces publication-quality graphics
- Support for everything from simple regression to complex multivariate and machine learning models
- Structural equation modeling and other advanced techniques through specialized packages
- An open-source, collaborative structure that supports reproducibility and transparent code sharing
R Pros and Cons
R costs nothing to use and gives researchers the freedom to build custom models and visualizations that fixed-menu software cannot replicate. A large global community means help is rarely far away, and most statistical methods published in recent years already have an R package built around them. The downside is the learning curve. R expects users to understand both a coding language and the statistical theory behind their models, which takes time for newer researchers to master, and debugging code errors can eat into time that should go toward analysis and writing.
Who Should Use R
Advanced researchers, data scientists, and statisticians who need custom analysis and are willing to invest time learning the language will get the most out of R. It also suits scholars working on interdisciplinary or data-heavy theses where no single off-the-shelf test fits the research design.
3. SAS (Statistical Analysis System)
SAS is a commercial statistical suite built for organizations working with large, complex datasets, particularly in healthcare, finance, and large-scale social science research.
Key Features of SAS
- Data management tools that simplify cleaning and transforming large datasets
- Predictive analytics integrated with custom reporting for decision-making
- A range of built-in machine learning algorithms for modeling
- Polished, presentation-ready reporting for technical and non-technical audiences
- Strong audit trail and validation features suited to regulated industries
SAS Pros and Cons
SAS scales well for big data analysis and includes strong security features, which is why it is trusted by organizations handling sensitive information such as patient records or financial data. The tradeoffs are steep licensing costs and a learning curve that rivals or exceeds R, making it a difficult entry point for first-time users or individual scholars without institutional access.
Who Should Use SAS
Healthcare and finance researchers working with large datasets and complex analytical requirements, and who have institutional budget for licensing, are best positioned to benefit from SAS. It is less practical for individual master’s or PhD scholars working independently.
4. Stata
Stata combines data management, statistical analysis, and graphical visualization in one package. It is especially popular in economics, sociology, political science, and public health research.
Key Features of Stata
- Data manipulation tools for reshaping, merging, and transforming datasets
- Purpose-built econometric and time-series analysis functions
- Standard statistical tests including ANOVA, chi-square, and regression analysis
- Panel data analysis tools commonly used in economics and public policy research
- Built-in tools for generating publication-quality graphs and plots
Stata Pros and Cons
Stata sits in a comfortable middle ground between accessibility and analytical power. It is more approachable than SAS, and a strong global community of economists and social scientists means troubleshooting resources are easy to find, including detailed documentation for nearly every command. Pricing is the main drawback. It is not cheap, which pushes some students and independent researchers toward R instead, particularly for one-off thesis projects.
Who Should Use Stata
Economists, sociologists, and public health researchers who need strong econometric tools without SAS-level complexity tend to find Stata the best fit, especially for panel data and time-series based dissertations.
5. MATLAB
MATLAB is less a statistics package and more a numerical computing environment. Its core strength lies in matrix operations, simulations, and engineering-oriented computation, with statistical tools available as a secondary feature.
Key Features of MATLAB
- Advanced matrix operations suited to engineering, physics, and applied mathematics
- Simulation capabilities for modeling computational experiments
- A library of toolboxes covering statistics, signal processing, and more
- Professional-grade plotting tools for visualizing complex datasets
- Integration with hardware and real-time data acquisition systems in engineering research
MATLAB Pros and Cons
For numerical computation and simulation-heavy work, MATLAB is difficult to beat, and its customizable toolboxes make it adaptable to specific research needs across engineering disciplines. The downsides are cost and focus. Licensing is expensive for individual users and small research groups, and statistics is not MATLAB’s primary purpose, so purely statistical work is often handled faster and more affordably elsewhere.
Who Should Use MATLAB
Engineers, physicists, and researchers running numerical simulations rather than traditional statistical analysis will find MATLAB the strongest fit among these six tools. It is a poor match for a scholar whose thesis is primarily survey-based or social science statistical analysis.
6. Excel
Microsoft Excel remains the most widely used tool for basic statistical work, particularly with smaller datasets, largely because nearly every researcher already has access to it.
Key Features of Excel
- Basic statistical functions, including mean, median, mode, and standard deviation
- A range of chart types for straightforward data visualization
- Pivot tables for summarizing and analyzing large blocks of data
- The Data Analysis ToolPak, which adds regression, ANOVA, and other statistical functions
- Familiar formula syntax that most researchers already know from everyday use
Excel Pros and Cons
Excel’s biggest strength is accessibility. It requires no programming knowledge, is inexpensive or already included in office software packages, and works well for basic computations or planning tasks. Its limitations show up quickly with complex or large-scale analysis. Excel lacks the advanced statistical modeling and machine learning capabilities found in SPSS or R, and it becomes unreliable and slow once datasets grow beyond a few thousand rows with multiple variables.
Who Should Use Excel
Researchers doing simple computations, or anyone who needs quick, accessible analysis without investing in specialized software, will find Excel sufficient for early-stage or smaller-scale work. Most thesis committees expect a more specialized tool once the analysis moves beyond basic descriptive statistics.
How to Choose the Right Statistical Software for Your Research
Matching software to your research question matters more than picking the most powerful tool available. Social scientists often gravitate toward SPSS or Stata for their balance of usability and analytical power. Economists lean on Stata’s econometric strengths. Data scientists and statisticians favor R for its flexibility and cost. Engineers reach for MATLAB when the work centers on computation and simulation rather than classical statistics. Researchers working with smaller datasets or early-stage projects often start with Excel before moving to specialized software.
A few practical questions can narrow the decision further. What does your department or supervisor expect or require. What is your dataset size and structure. Do you already have coding experience, or would a menu-driven tool save time you would otherwise spend learning syntax. Does your institution provide a license, or would you be paying out of pocket. Answering these before committing to a tool avoids the common mistake of learning an entire software package only to discover it cannot run the specific test your research design requires.
Frequently Asked Questions
It depends on the discipline. Social science and health research theses often use SPSS or Stata, while data-heavy or interdisciplinary theses increasingly use R for its flexibility and cost advantage. Engineering and applied science theses tend to lean on MATLAB instead.
R offers more flexibility and is free, but it requires coding skills. SPSS is easier to learn but comes with licensing costs. The better option depends on your technical background and budget, and some scholars end up using both at different stages of the same project.
Excel works for basic descriptive statistics and small datasets, but most dissertation committees expect more advanced software like SPSS, R, or Stata for anything beyond preliminary analysis, particularly once inferential statistics or hypothesis testing come into play
The right test depends on your research questions, the type of data you collected, and your research design, whether that is comparing groups, measuring relationships, or predicting outcomes. Many scholars consult their supervisor or a data analysis specialist before finalizing the analysis plan, since choosing the wrong test can compromise an otherwise solid study
Yes. SPSS remains widely taught and used in social science, education, and health research programs specifically because of its accessibility. Newer tools like R offer more flexibility, but SPSS is still considered a credible, widely accepted choice by most thesis committees
Not necessarily. Tools like SPSS, Stata, and Excel allow researchers to run standard statistical tests without writing code. Coding becomes more useful, though not always required, for custom analysis, larger datasets, or fields where R or Python has become the field standard
Costs vary widely. R and basic Excel functions are free or already available. SPSS, Stata, SAS, and MATLAB all require paid licenses, though many universities provide student access through institutional agreements. It is worth checking with your department before purchasing a personal license
Descriptive statistics, which summarize data through measures like mean and standard deviation, can usually be handled by any of these tools, including Excel. Inferential statistics, which draw conclusions or test hypotheses about a broader population, generally require more capable software like SPSS, R, Stata, or SAS.
How Qundeel Academic Consultancy Helps Students with Statistical Analysis
Picking the right software is only the first step. Running the analysis correctly, choosing the appropriate statistical test for the research design, and interpreting the output in a way that satisfies a thesis committee or journal reviewer takes both statistical knowledge and subject-matter expertise, something many scholars are not trained for even after years of coursework.
Qundeel Academic Consultancy works with MPhil, MS, and PhD scholars across Pakistan, the UK, the UAE, the USA, and beyond, supporting exactly this stage of the research process. The team includes 128 PhD-qualified experts across disciplines, and has assisted more than 8,300 scholars to date, reflected in a 4.9-star rating from over 180 reviews.
For students who are unsure which software fits their study design, Qundeel helps identify the right tool before analysis even begins, based on the specific research questions, hypotheses, and data type involved. For students who have already collected data but are stuck on execution, whether that means running regression models in SPSS, structural equation modeling in R, or panel data analysis in Stata, the team provides hands-on support to make sure the analysis is accurate and defensible.
Beyond running the numbers, Qundeel also helps scholars interpret and present statistical output in a clear, committee-ready format, translating raw software results into a results chapter that reads well and holds up under scrutiny. This matters particularly for scholars whose research training focused more on their subject area than on statistics itself, where the gap between collecting data and correctly analyzing it can otherwise stall an entire thesis timeline.
For scholars who want to avoid the common pitfalls of self-taught statistical analysis, whether that means choosing the wrong test, misinterpreting output, or running into last-minute software errors close to a submission deadline, working with a specialist consultancy like Qundeel can save significant time and reduce risk at one of the most critical stages of the research process. Scholars can reach out through qundeel.com to discuss their specific dataset and research design before deciding on the right statistical approach.
